Edit: In the interest of clarity and at Robert's request, shortly after making this post, Robert Collins, the owner of BE bearings, reached out to Peter to let him know he was frustrated with me over this post. Peter told Robert to call me to discuss it and said he trusted my assessment. I reached out to Robert via Social Media to discuss. We chatted a little bit, where he informed me that he had updated the graphs to include the OEM startup RPM (in addition to OEM pressure) with the BE startup graphs. I will share screenshots of those for transparency on the next page.
Peter, I might be late coming in tomorrow, lol. This will be high effort
As Peter said, we intend to throw no shade at all at BE with what we're saying here- We think they offer an excellent product, a necessary[/B] product, and did solid due diligence in researching their product before releasing it to the general public.
However, I cannot advise treating their article (linked immediately below and further referenced in this comment) as a peer-reviewed proof. They draw some unfounded and concerning conclusions throughout the article, which led me to doubt the study's validity entirely.
Link to referenced article
https://www.wiki-diy.com/index.php/Oil_Flow_-_S65_Oil_Flow_Analysis?
The first thing that raised my eyebrow was the section where they referenced oil flow:
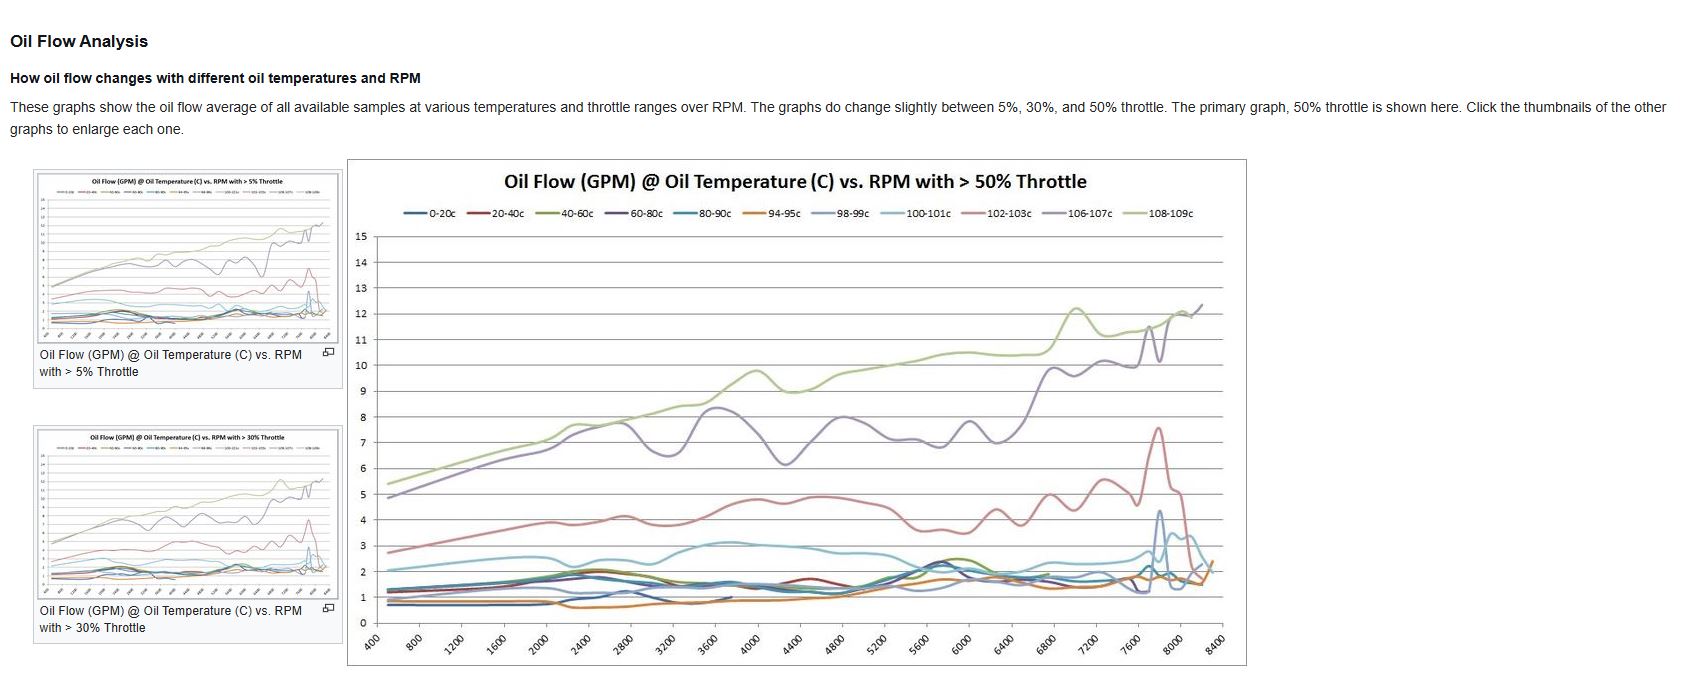
The fact that oil flow never gets above 2.5 GPM until the motor reaches 100 °C, then has a roughly 300% increase in flow from 98 °C to 103 °C and a 600% increase in flow from 98 °C to 109 °C tells me that the sensor (Flow Tech, see the next image) was mounted between the oil thermostat and the oil cooler. This placement is H I H G L Y problematic-
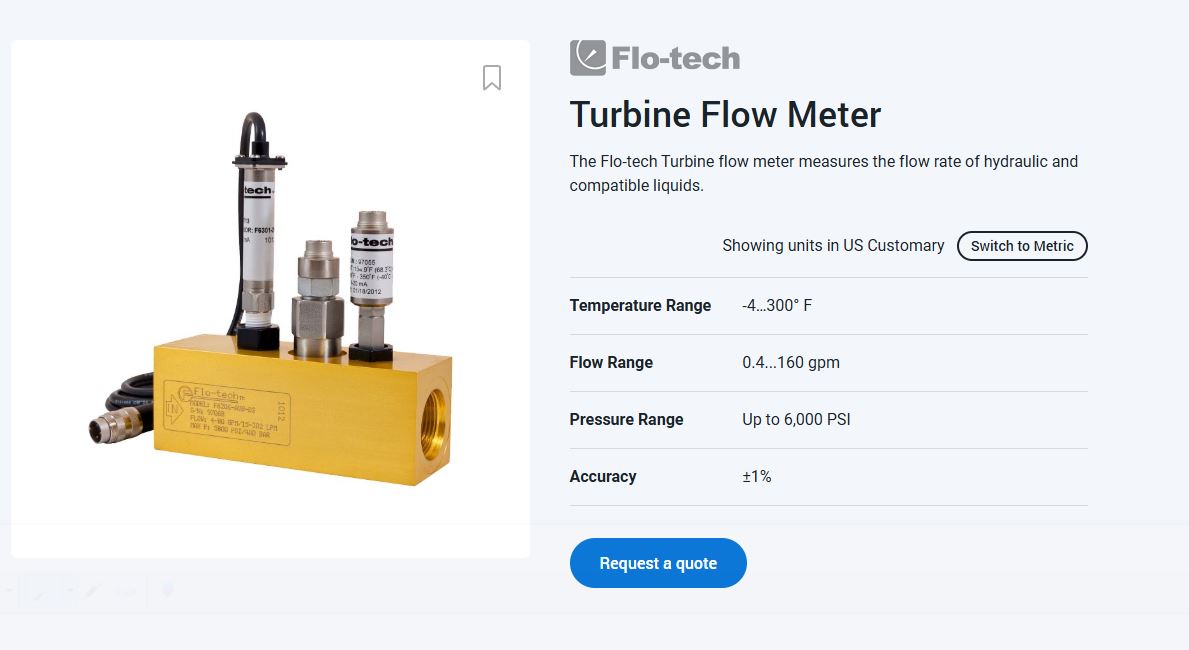
Placing the flow sensor between the oil cooler and the thermostat is problematic because, even when the oil is above operating temperature and the thermostat is fully open, a percentage of the oil can still bypass the oil cooler as a function of DeltaP between the two routes of flow- the oil cooler is a restriction on the system, as is the fully engaged thermostat. Pressure is a function of flow and restriction. More on that later.
This creates a multi-dynamic scenario in which one of your key data points is influenced by more than the single variable you are testing. In this case, the flow measured is influenced not only by the intentional change you are making, but also by the secondary effects your change has on the flow rates of the thermostatic bypass and the oil cooler, which will not necessarily be affected 1:1. There are a handful of easy workarounds for this that they chose not to do, either because they did not think it would matter, or because they were unaware of this issue. Either case is cause for concern IMO.
Then, I saw their claims about the time to pressure being significantly shorter
This honestly had me baffled- I was lost at how this could be possible. Maybe because the reduced restriction allowed any air in the system to escape that bit faster? doubtful. Maybe because the theoretically increased flow allowed the pressure to get to the bearings faster? I don't think that's how it works in a system like this- the pump is going to move a specific volume below its relief pressure. That line of logic led me to the smoking gun. RPM.
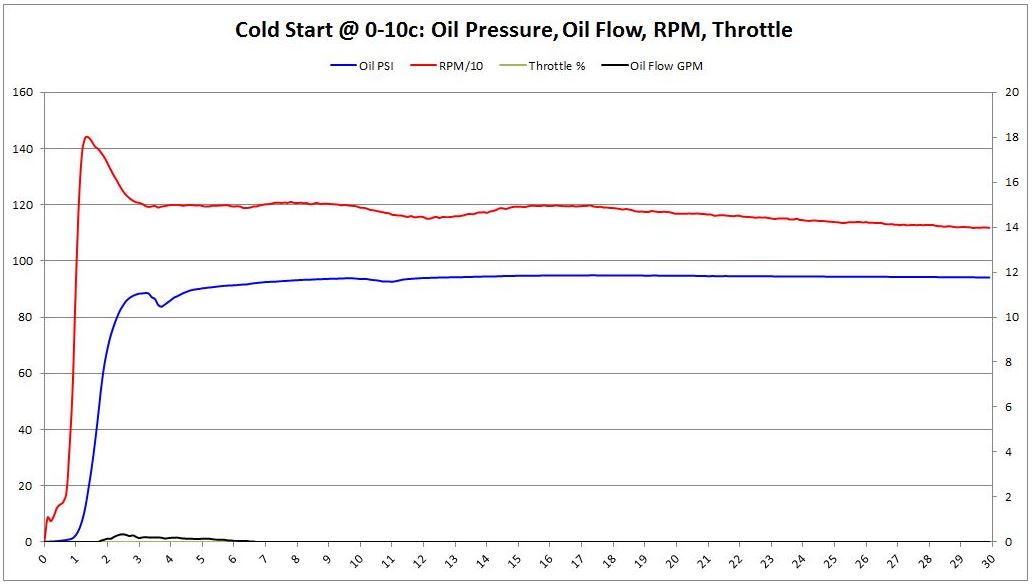
I am going to have a lot of screenshots of their graphs here; bear with me while I try to illustrate what I noticed.
0-10 °C BE 1.9 seconds to 90% pressure, OEM 2.6 seconds to 90% pressure.
BE:
OEM:
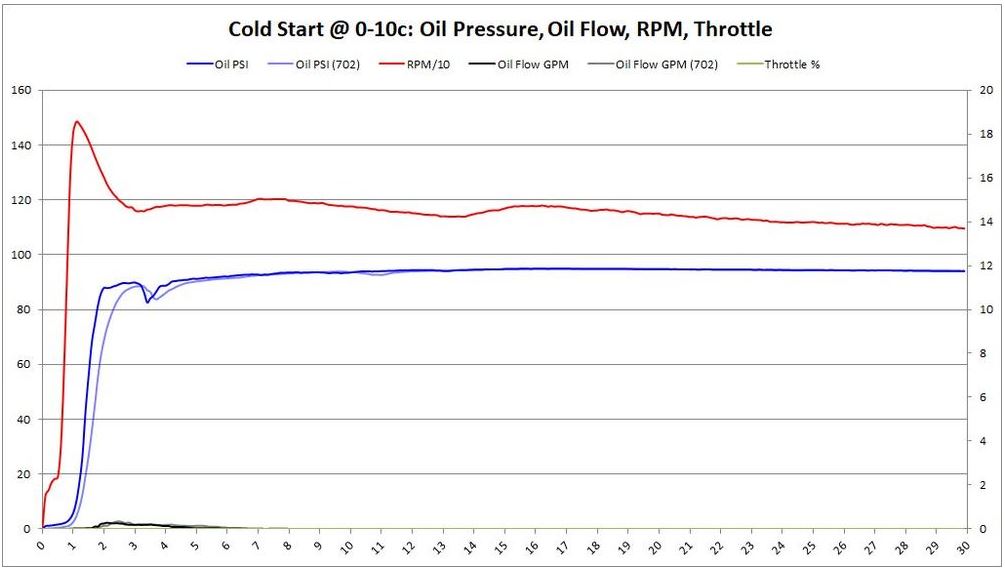
Do you see it? Why did they leave out start up RPM from the OE bearing test?
Also take note of the pressure dip at ~3 seconds... That is a VANOS sweep... that will be important later.
How about now?
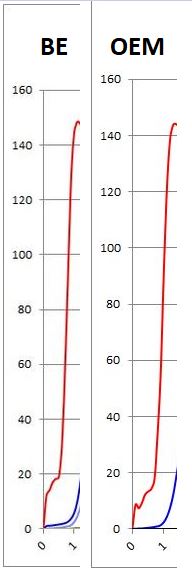
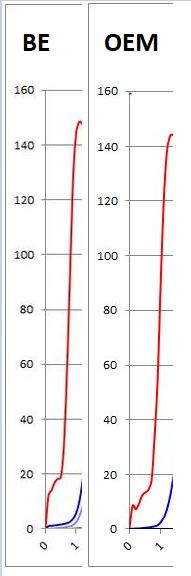
The 2nd capture is after I scaled the RPM axis to match BE, so you could also see the difference in peak RPM without it being different for no apparent reason.
Why would they overlay the OEM time to pressure in their direct comparison, but not the OEM RPM log as well?
I think if they had, they would have seen where the faster time to pressure came from- not the bearings, but the different startup profile- possibly from a tune? These things matter.
Here are the rest for consideration of my overarching point- BE does solid work, they offer a great product,
but this study is deeply flawed.
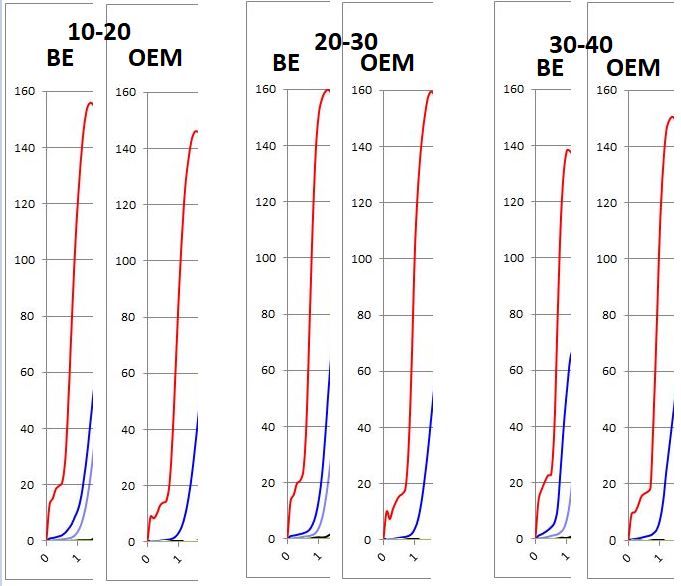
In the image above, you'll note that I added the individual second scale to the horizontal axis because the OEM bearings were marked on every fifth number, and the BE bearings had every second marked. After I verified that the scales matched in distance but not in granularity, I aligned them for an apples-to-apples comparison. You'll notice the OEM logs all hit peak RPM later than the BE logs, and that, with the exception of the 30-40 °C run, the OEM logs show a lower peak RPM. Again, pressure is a function of Restriction and flow volume. Flow volume is a function of pump RPM (below bypass pressure). Pump RPM is a function of Engine RPM.
It is quite obvious then, that their conclusion that the BE bearings caused the decrease in time to pressure is entirely false:
AutoTalent wrote It's very clear from these graphs, that the oil pressure comes up faster with BE Bearings than BMW Factory bearings. Having oil pressure come up faster and lubricating the bearings is a huge benefit to reduce bearing wear and increase bearing longevity. This was an unexpected surprise that we didn't anticipate. The graphs also show no decrease in oil pressure over factory bearings. This should allay fears that increased clearance would decrease oil pressure, especially during this critical "Cold Start" time period.
More concerning, if they did tune the car in between these tests without realizing it would make a difference, what else was changed? Did they change the oil cooler? That would have a profound impact on the measured flow in their arrangement.
Moving on to measured oil pressures at given temperatures-
Mostly no notes. Except for a few.
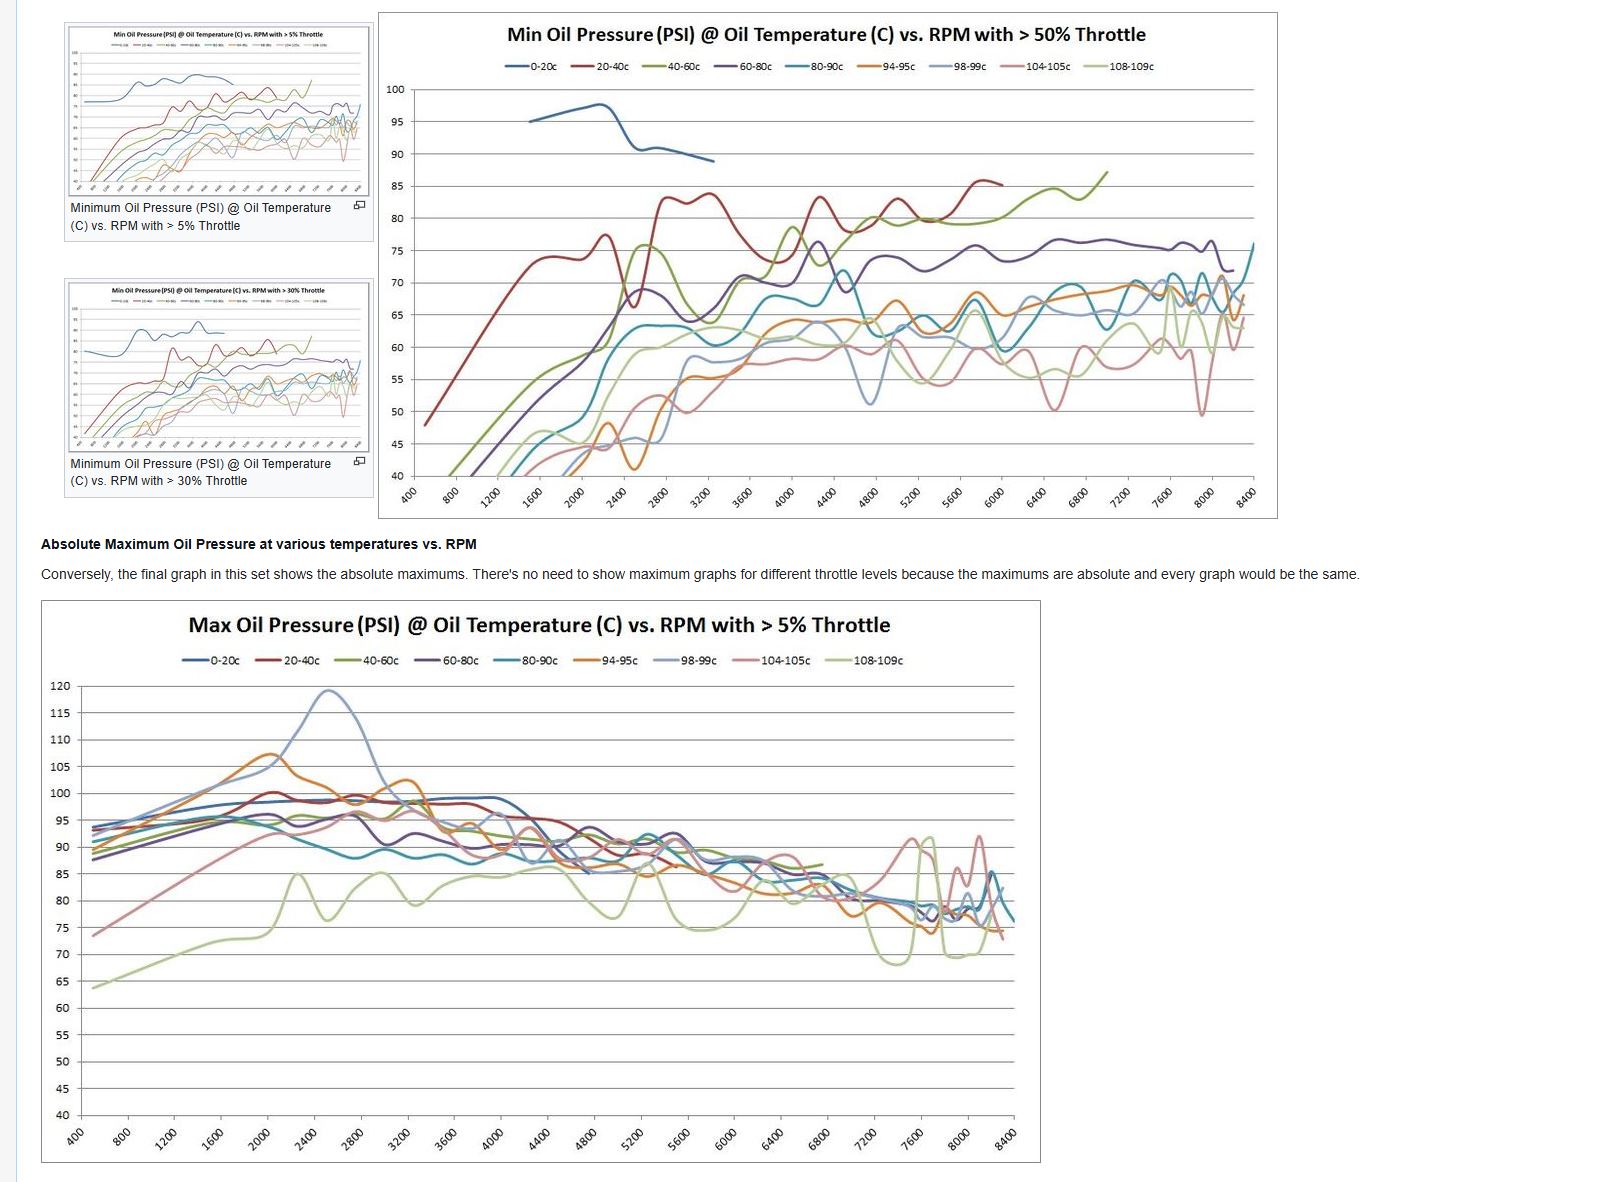
These are WAY different. like... from different tests altogether, it stands out so much; not just different from each other, but also different in a way that makes no sense at all.
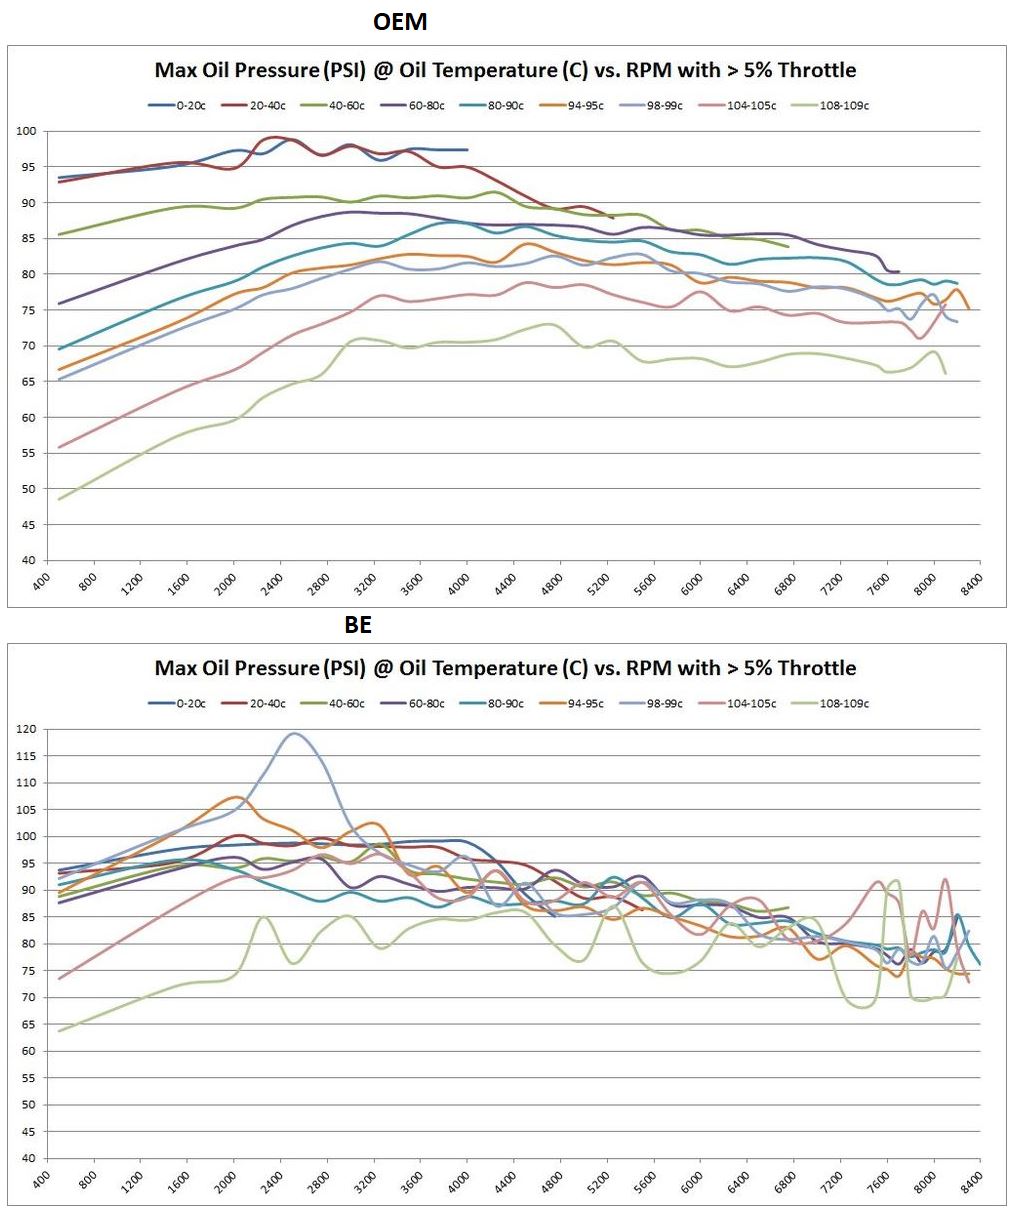
Also, why are these two graphs the only graphs that measure anything >5% throttle? you could theoretically get wildly different data for the same parameters without being outside the rules of this chart- one chart could be nothing but slow builds to redline at a steady state 20-50% throttle, the other could be WOT rips. We need live throttle data in these charts to make sense of them, not just "greater than 50%" as the tightest throttle constraint.
Fun fact- VANOS maps are RPM X Torque Request. Remember earlier when I said you should take note of the dip in oil pressure at the ~3-second mark on all those cold start logs because it is a VANOS sweep? This is where it matters. Also of note- that dip is a fairly lazy vanos sweep. IIRC, the VANOS System can independently sweep each cam at up to 360 degrees per second. This consumes a significant amount of oil volume while the VANOS target is changing rapidly, which occurs much more in the mid-throttle, 5-7000 RPM range. As I said above, VANOS target is based on RPM X Throttle %- this means while in the mid-range RPM and modulating the throttle as you would in a corner at speed, VANOS is having a disco party lol, and RAPIDLY consuming oil volume in the process, potentially tanking oil pressure- I think this is why we see such a noisy plot in the referenced tables. Also of note, during WOT, VANOS is relatively steady state, making only slight adjustments as the table traverses the RPM range- Matt, our in-house tuner, showed me the tables a few months ago, and the amount of change in the midrange legitimately blew my mind, especially compared to just how little change was happening under WOT.
I cannot make sense of this either: how is it that you have both increased the volume quite significantly (we've covered why that claim is not necessarily supported) AND you've significantly increased Oil pressure in the 108-109 °C range? It is a fact that you've increased clearances, thus reducing restriction, which would theoretically increase flow volume at the same oil pressure, but how is it that oil pressures are RISING when the oil is at its least viscous? The only thing I can think of is a lack of data points for this specific range and/or an error in data compilation.
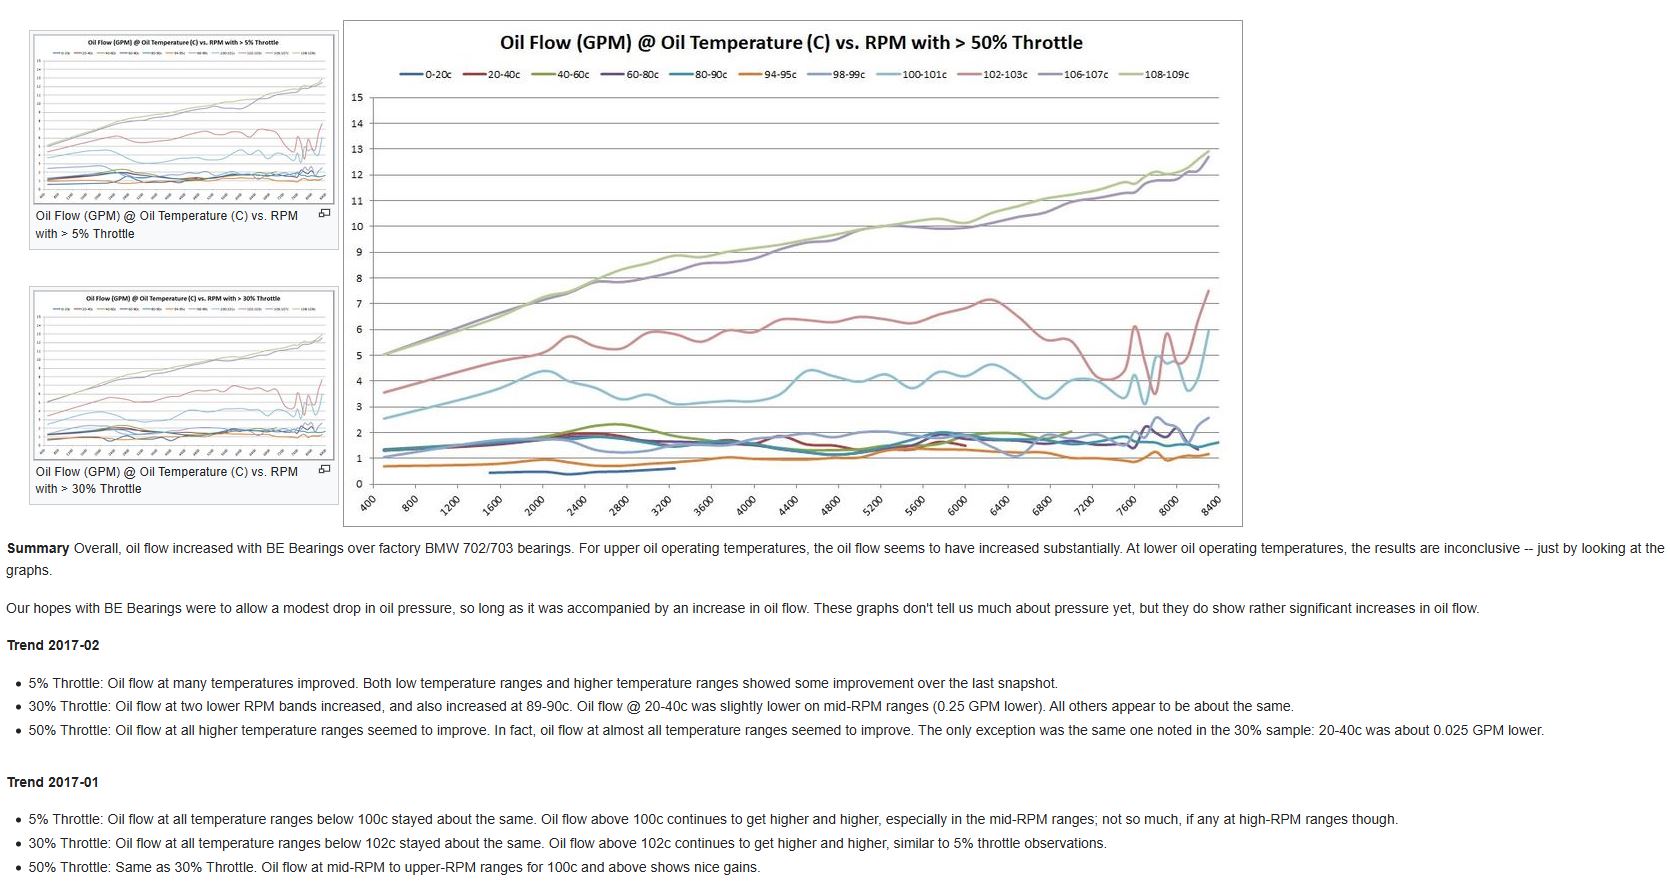
Finally, the claim that you have doubled oil flow volume while only losing 3PSI overall is just the result of bad data from a bad sampling point- I am sure you did increase volume throughput by increasing the clearances, and that is good for the rod bearings, but any PSI drop across the systemis going to be catastrophic to the mains due to their already sub-optimal geometries.
Which is what we are seeing across the board in the real world. We've pulled apart 150k-mile S65s with stock rod bearings- the RBs are always in bad shape, but the mains are typically in much better shape than lower-mile motors that are in for rebuild, only to discover that the block and crank are both trash because the #1 main spun, and the rest of the mains look TERRIBLE. We're talking dozens of S65s that all tell the same story.
Here's the thing- going from a clearance of .0006" (minimum spec for early S65s IIRC) to .0022", which is what BE is IIRC (that's what the SRD paper cited), then you reduce the resistance of the slot (bearing clearance) by as much as 98%- that is a greater than 49x increase in potential conductance! Now, obviously, that number comes from making some simplifying assumptions and ignores all the dynamics going on in the journal, but the fact remains: you've effectively taken the cap off the main bearing and reduced one of its key downstream restrictions to basically fuck all. As BE pointed out, flow volume is the key to good wedge formation- that is why on all of these S65s weve gotten with spun main bearings, the rod bearings are PRISTINE (except for the rods affected by the welded-closed main bearing feed inlet) those rod bearings are getting 80-90% of the flow that is meant to be shared between the mains and rods.
By opening up the rod bearing clearances and leaving the main bearings as OEM, you are creating a wildly imbalanced system. As Peter said- at least spend the extra $400 on the overdrive kit to get more flow through the mains too!
AutoTalent- I want to reiterate, my goal here is not at all to insult you or BE- we genuinely appreciate what you all have done for the community, and it is obvious that you put a lot of time and effort into documenting your findings, AND that you made a huge effort to be entirely transparent in the process.
I respect the hell out of that, and if at any point I've sounded like I was attempting to call your integrity into question, I hope you know that is not my goal, nor is it what I think. This is the peer review process. I have been on the business end of this more than once, and it is not an enjoyable place to be. It is quite easy to go through someone else's work and find all the flaws. It is another thing entirely to do the work and create information for your peers to pick apart. This is all in the effort of finding the best answer for the community. I hope you can understand that.
We have nothing to sell here- we buy BE bearings, and we buy SRD gears because we believe in both products. Peter would never allow us to use anything we do not believe is the best product we can source.
Moving on- here is what I am still trying to work out: The oil pump is a variable displacement rotary vane pump. It has no electronic controls whatsoever. I had one of these $3000 pumps apart last week, and I had another open several months ago (sorry Peter lol, I promise I put them back together properly). Ive been digging into them because I cannot wrap my head around the oil pressure behaviors I see in the datalogs.
What I know- the pump has two methods of bypassing excess volume, both based on pressure. Primarily, it uses variable geometry to reduce flow, thereby reducing pressure as a function of flow. Secondly, it uses a traditional bypass valve set to a higher pressure.
What doesn't make sense, though, is that if the pump is flowing more than enough oil to achieve the requisite pressure after X RPM, then the pressure should not drop off after it reaches the bypass pressure- this should happen smoothly as well, because of the variable displacement functionality. It should reach the target pressure, as dictated by the spring, and stay there. Period.
As VANOS consumes oil, the system should react nearly instantaneously to that increased volume demand- the 20 PSI swings we see in the chart below simply do not make sense in this situation. Dips and bumps, sure, but not such massive swings in pressure as seen below:
What we suspect to be happening is that the oil pump is insufficient in stock form- this makes sense if you think about BMW's design goals in the early 2000s, when oil prices were at all-time highs- maximize performance, minimize fuel consumption. Maybe they thought that cars getting 20 mpg on the highway instead of 19 would sell 20% more cars, so they reduced drag wherever they could in the name of performance and efficiency. So they engineered a pump that was juuuuuuust right for the stock clearances.
Then we opened up the bearing clearances because thats what worked of the E46. Oof.
If the pump is NOT riding on the bypass spring much at all, which I doubt it is, then these variances would make a lot more sense. I cannot imagine that the pump is bypassing much at all at 70 PSI while flowing over 13GPM, if it's able to build 85 PSI at 40-60 °C at ~3kRPM and only flowing 8-9 GPM.
The bypass will bypass at a specific PSI- temperature or oil viscosity be damned. There needs to be sufficient pressure on the spring to move it. That pressure is a function of restriction and volume. At low temperatures, there is sufficient restriction (because of the significantly higher viscosity) to generate enough pressure at the volume of flow the pump is capable of producing to hit the bypass threshold. In all other times, it appears that this is not the case- even in stock form. Increasing clearances without increasing the pump flow rate will only exacerbate this.
This is a solid article on the functionality of a variable displacement pump if anyone is curious- although this one has an electronic control solenoid that allows it to be switched between high and low pressure- notice how locked in it is at its set pressure (although you have to be aware that this is a far less dynamic situation than an engine)

As AutoTalent said- testing equipment is expensive- the Flow Technologies turbine was $1000, and they bought it to attempt to gather more useful data. Hats off to them for their commitment.
We just spent $60,000 upgrading and redesigning our engine dyno (in addition to the initial $50,000 up front cost from SuperFlow) for the same damn reason. We want nothing but absolutely conclusive data on everything we do and every product we support.
Anything less is insufficient.


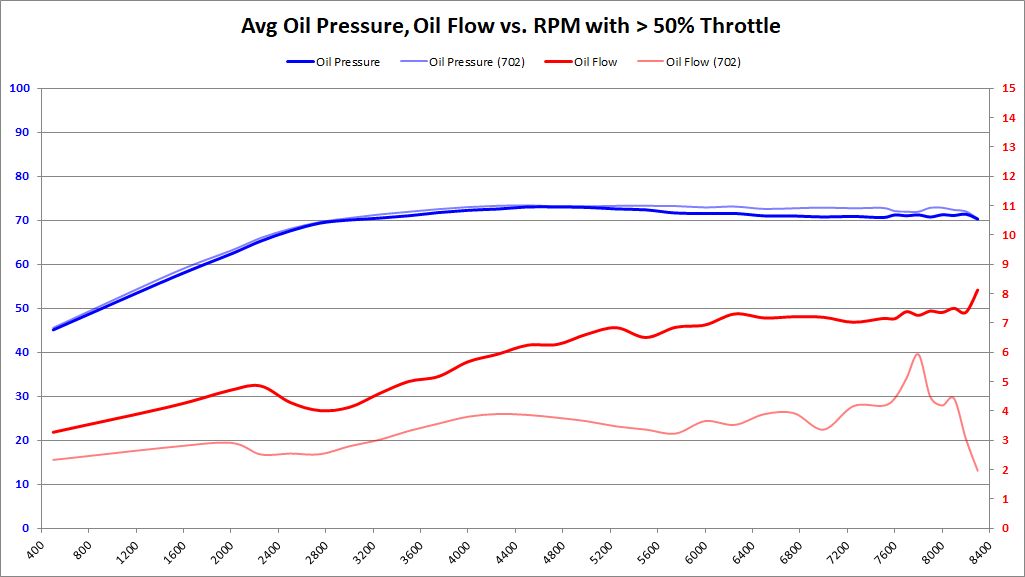


 , but I think in general, points are valid to give some insight into oil pressure behaviors in an engine esp to those that are not familiar.
