 |
|
 |

|
|
|
| 12-27-2016, 12:07 PM | #1 |
|
Lieutenant General
 2319
Rep 12,654
Posts |
BE Bearings In-Depth: Oil Flow, Oil Pressure Analysis
Posted with permission of BE Bearings
Table of Contents
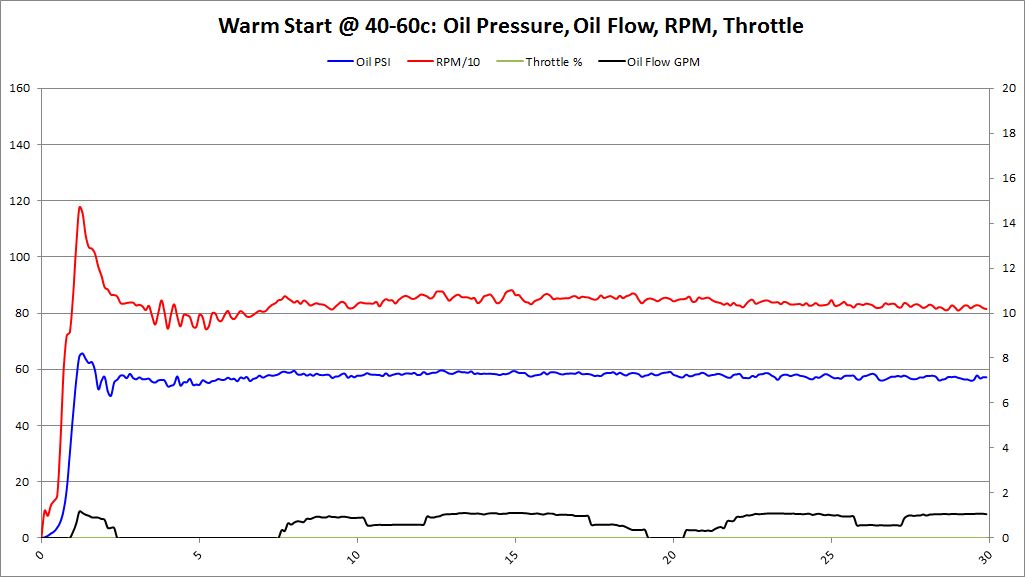
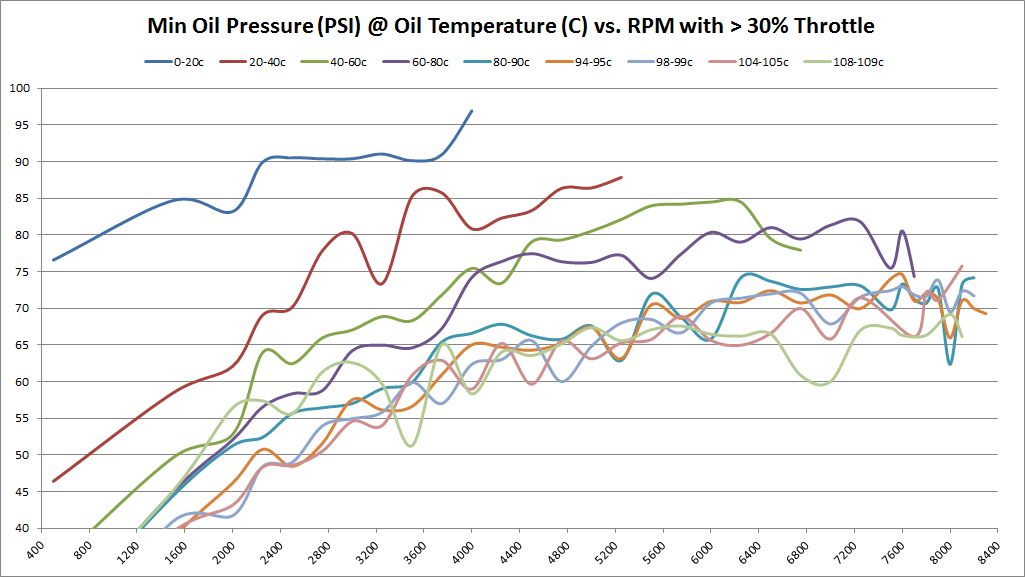
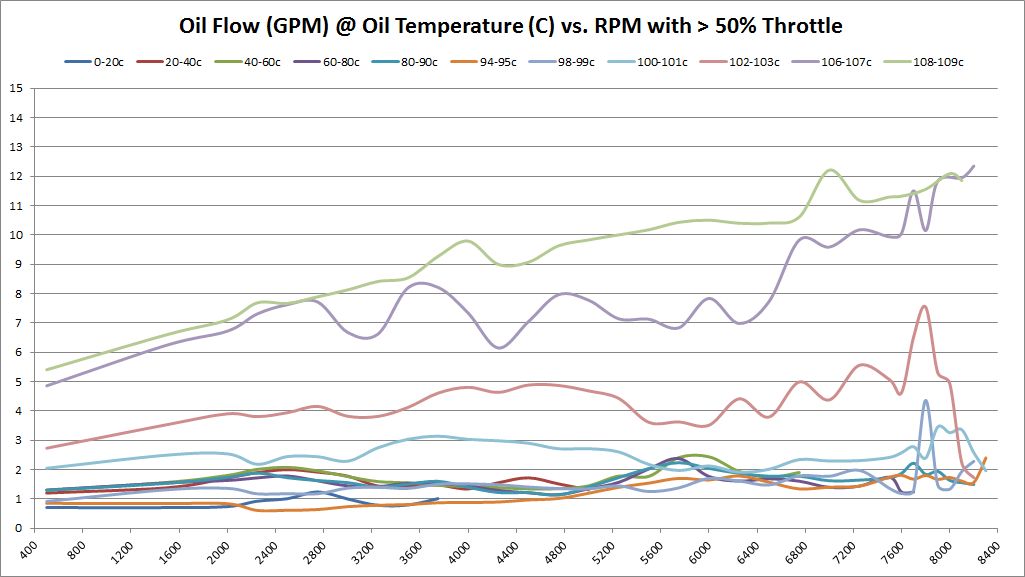
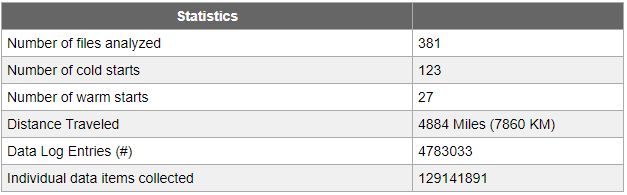
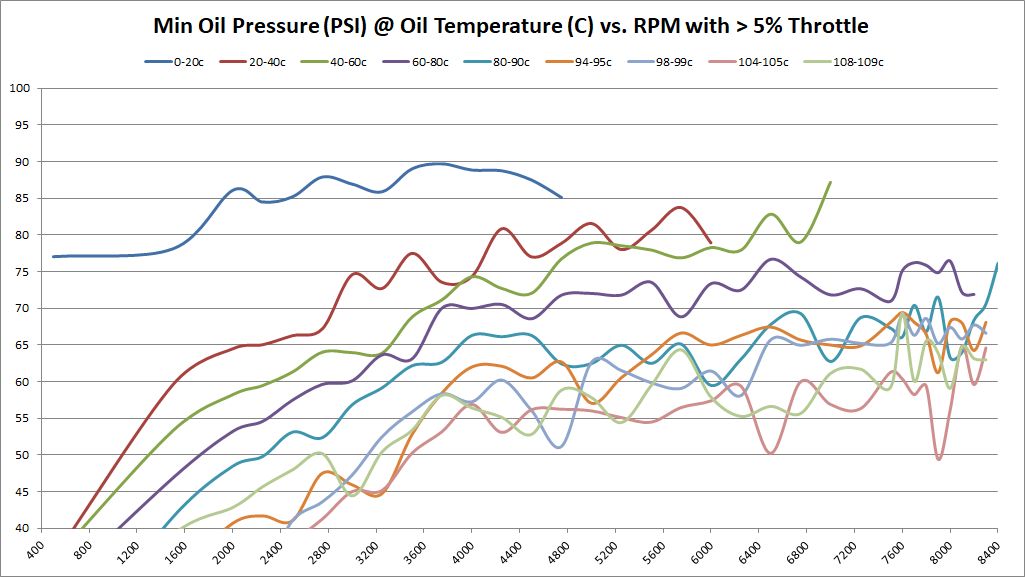
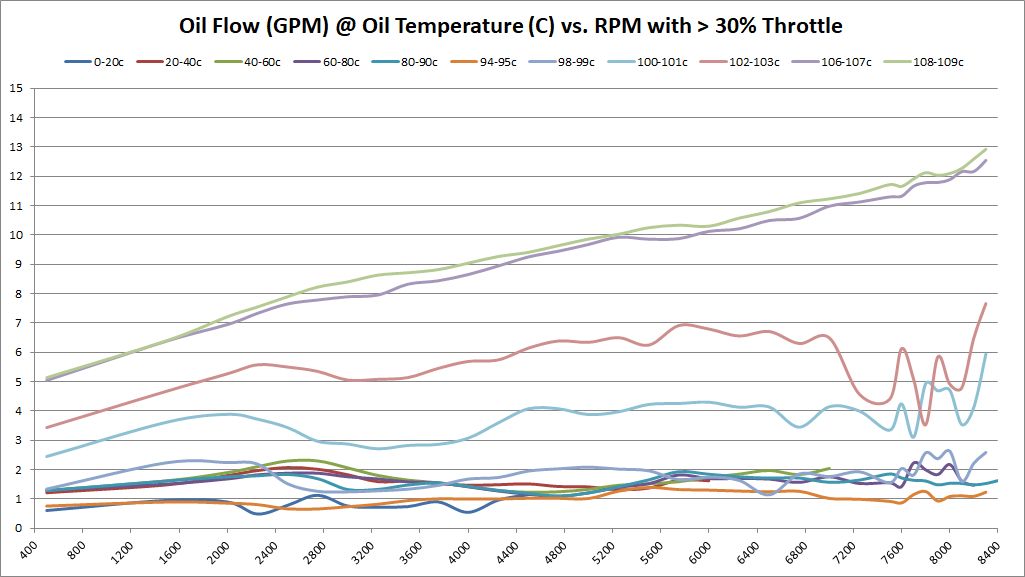
Article Source: BE Bearings Wiki: http://wiki.rcollins.org/core/index...._Flow_Analysis Overview From the day BE Bearings was conceived, we knew we must figure out a way to test the bearings to ensure they caused no detrimental effects to the S65 engine. We also knew there wouldn’t be any perfect way to do this. We felt the most important thing to measure (oil flow) would also be the most difficult and most expensive. If our theories are correct about too little bearing clearance, then increasing the bearing clearance will show up as increased oil flow. But we had no idea how much, if any, that would be. From pricing the sensors, all we knew was that it was going to be expensive.Test Vehicle
Data logging Equipment
Data signals collected and stored
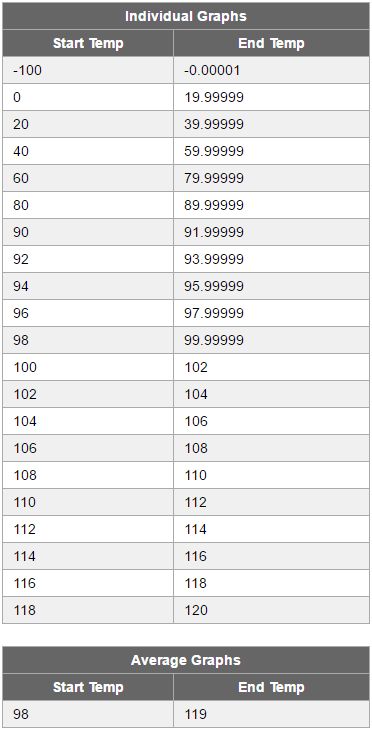
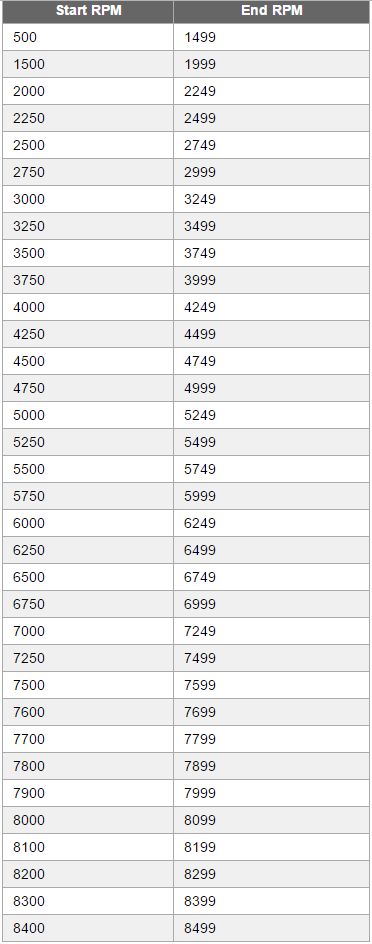
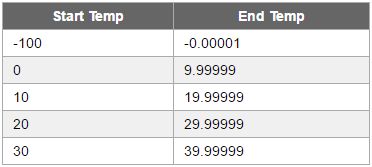
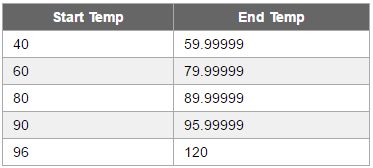
Driving Styles Everyday driving and hard corneringVehicle was driven as a daily driver. 27 miles to work in rush hour traffic each day. Hard corning when possible. Grocery getting and fast food runs when possible.Track day driving Test Definitions Temperature, RPM, and Cold/Warm Start RangesFor any given temperature range, a set of RPM ranges is defined for analysis. Any samples found within that temperature range, and RPM range are averaged. For mid RPM, tens of thousands, sometimes over one-hundred thousand samples will be averaged in a given temperature and RPM range. This method is intended to smooth out the results and limit the effect of outlying data. Last edited by AutoTalent; 12-30-2016 at 06:07 PM.. |
| 12-27-2016, 12:08 PM | #2 |
|
Lieutenant General
2319
Rep 12,654
Posts |
Testing Results: BE Bearings SP1527HK
Table of Contents
Testing Results: BE Bearings SP1527HK Current Snapshot: 2016-12-31 Previous Snapshots: Overview Last edited by AutoTalent; 01-03-2017 at 10:36 PM.. |
| 12-27-2016, 09:11 PM | #6 |
|
Major General
2760
Rep 5,483
Posts |
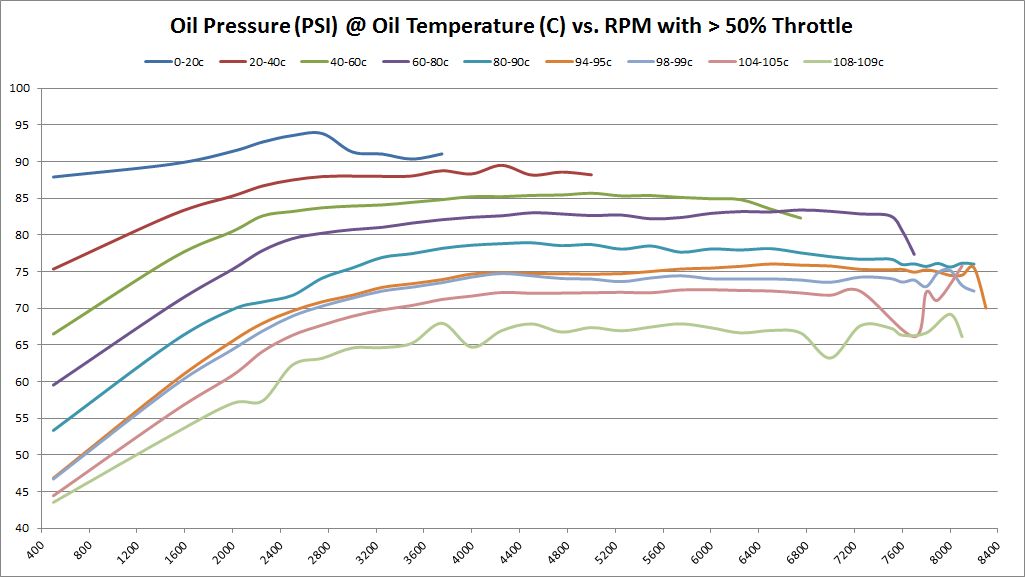
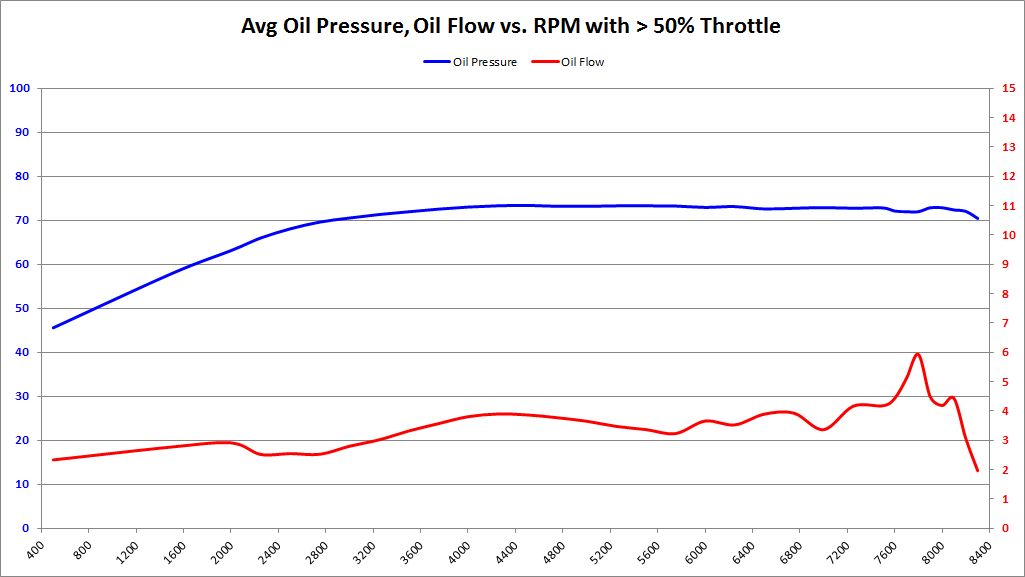
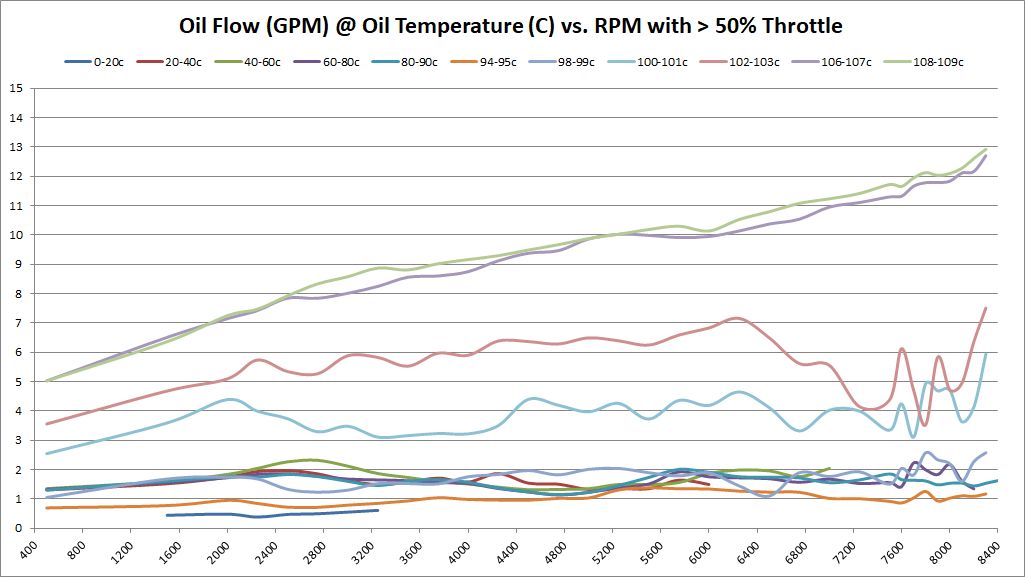
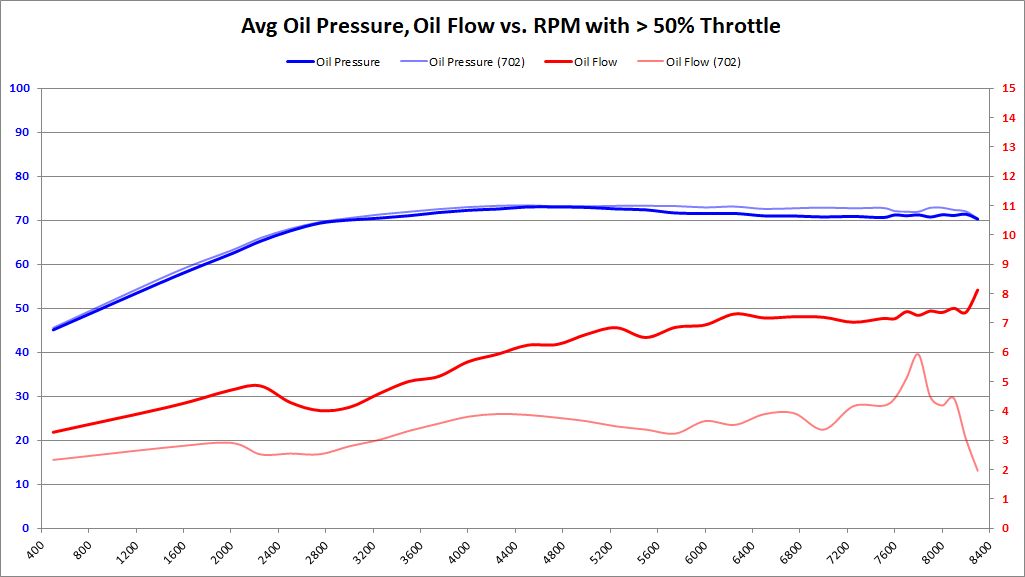
Nice. What do we think is happening to flow from 8k to 8300? Cavitation? Or does the pump just start dumping a ton of oil somewhere other than the direction of the measured flow path?
__________________
 |
|
Appreciate
0
|
| 12-27-2016, 10:37 PM | #7 | |
|
BimmerPost Supporting Vendor

1440
Rep 1,614
Posts  |
Quote:
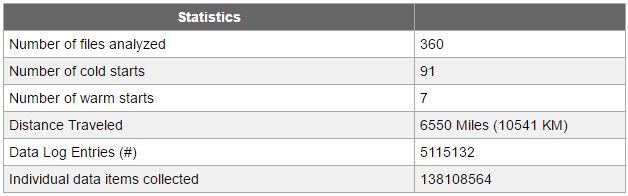
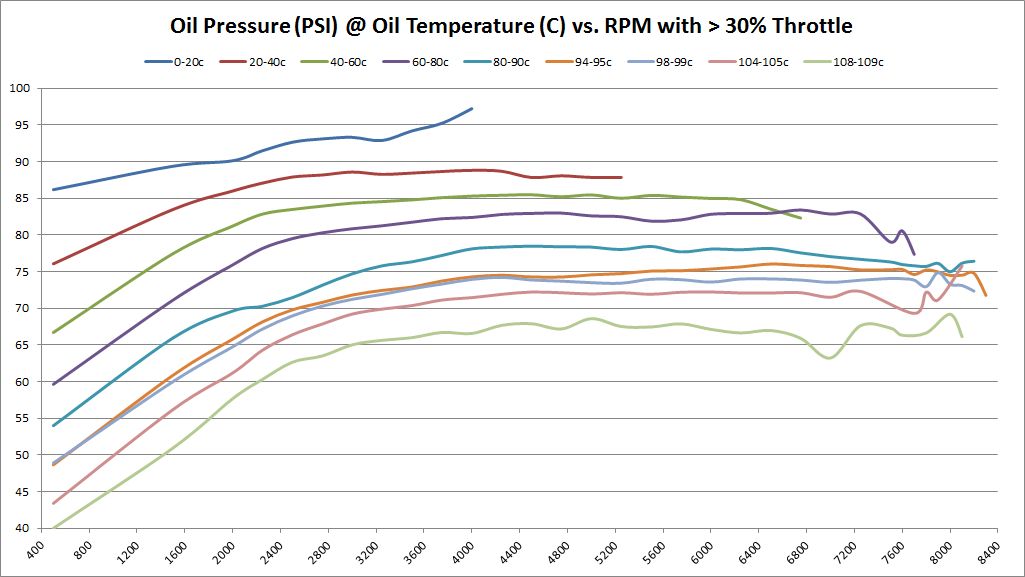
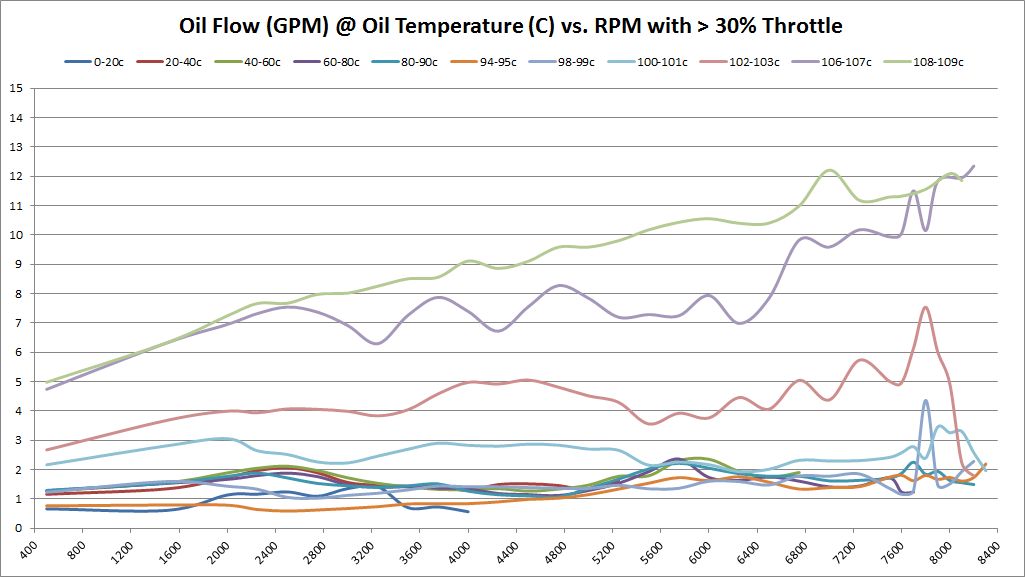
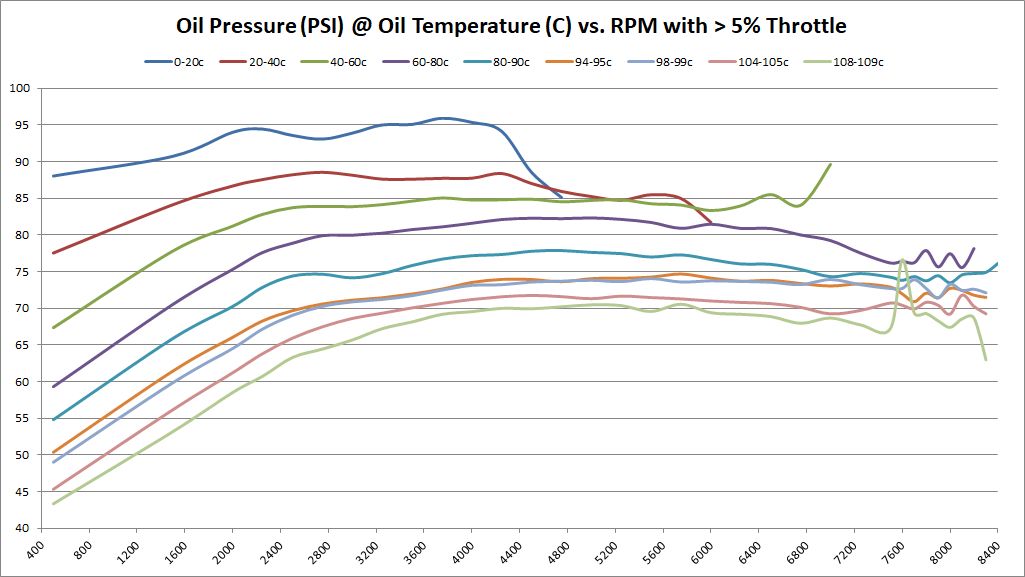
Most likely, it's the absence of adequate samples. Even though we collected 5+ million samples, on the "averages" graph, between 98-110c, there's only 51 samples between 8000-8300 RPM. The averages and shape of the graph also depends on what RPM those samples are taken. Realistically, the car only has 1st and 2nd gear to hit redline without risk trouble with the law. For the most part, we used 1st gear for high RPM runs with the factory 702/703 bearings. In hindsight, that might have been a mistake. So when you're shooting to max RPM, using mostly 1st gear, and your data logger is 10 Hz, a lot of RPM ranges can be unintentionally skipped in 1/10th of a second. We never really looked at the 702/703 data while collecting it. If we had, there was a simple adjustment we could have made to use 2nd gear more often than 1st gear for high RPM runs. So that's what we're doing with the BE Bearing data -- using 2nd gear more than 1st gear. Because of that, I can tell you we've collected many times more samples in the upper RPM ranges in just two months, than we did an entire year of 702/703 data collection. The graphs are much smoother in the upper RPM area. We plan to post the BE Bearing data once per month. The first batch of BE Bearing data should be up tomorrow and you'll see how it looks a bit smoother, but still has some peaks and valleys in it. |
|
|
Appreciate
0
|
| 12-28-2016, 11:25 AM | #8 |
|
Lieutenant General
2319
Rep 12,654
Posts |
Completely revamped and rewrote post #1.
This will make it easier to update with BE Bearing data as it becomes available. |
|
Appreciate
0
|
| 12-28-2016, 02:43 PM | #9 |
|
Lieutenant General
2319
Rep 12,654
Posts |
Table of Contents
Testing Results: BE Bearings SP1527HK Current Snapshot: 2016-11-30 Previous Snapshots: Overview Last edited by AutoTalent; 12-28-2016 at 03:15 PM.. |
|
Appreciate
0
|
| 12-28-2016, 04:40 PM | #10 |
|
Captain
 
83
Rep 985
Posts
Drives: 08 M5 Sapphire Black
Join Date: Oct 2005
Location: CT
|
What oil were you guys using for this?
What oil would be recommended? I've been running Mobil 1 0-40W in the winter, supplementing with 10w-60 as asked by the car. I don't drive a lot so it takes me a whole year to do 7000 miles and in that time I add about 3-4 quarts of 10w-60.
|
|
Appreciate
0
|
| 12-28-2016, 06:33 PM | #11 |
|
Brigadier General
3910
Rep 4,173
Posts |
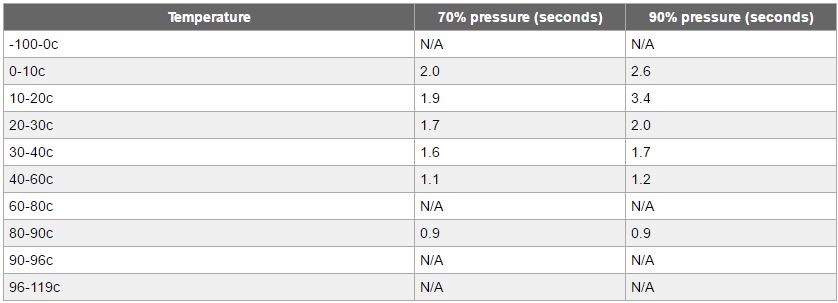
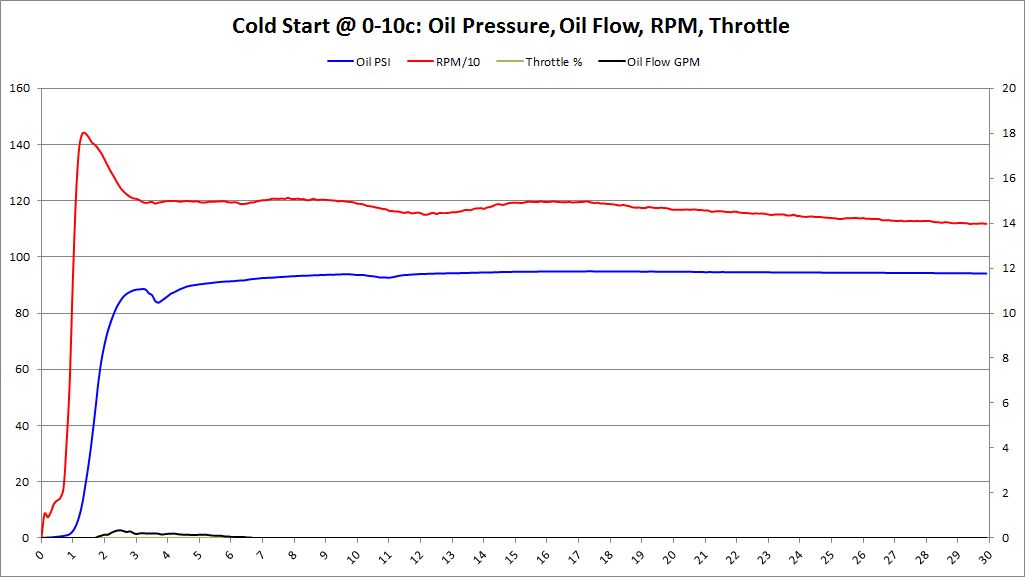
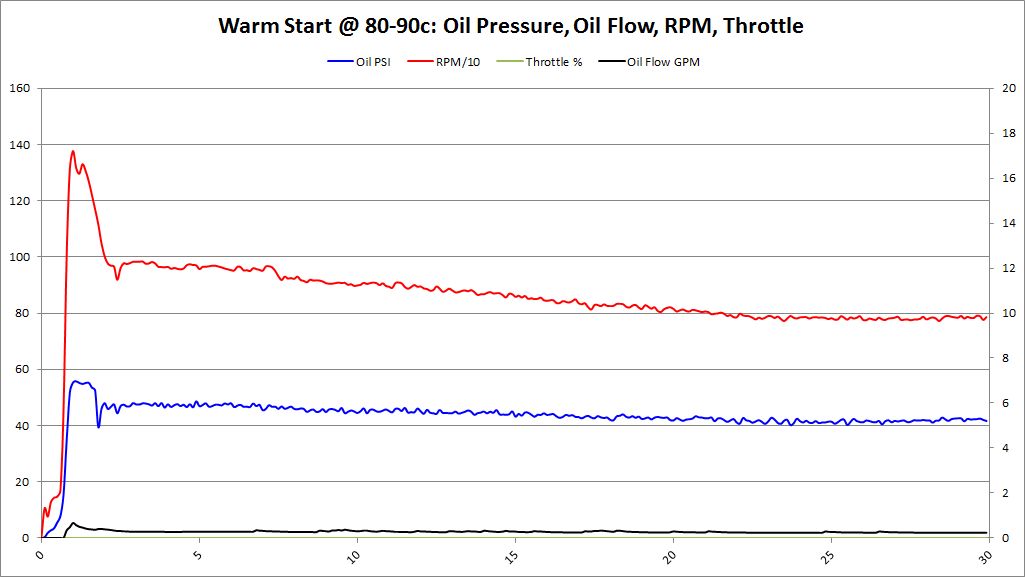
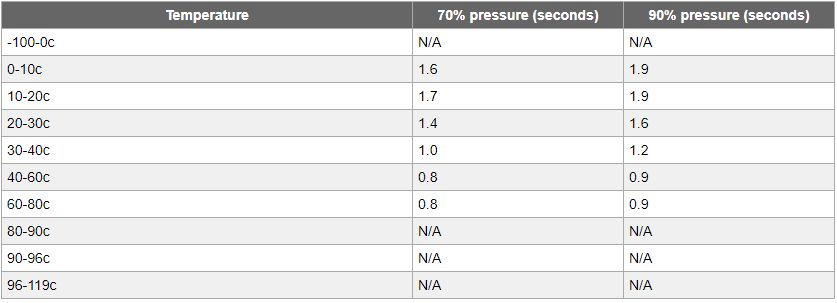
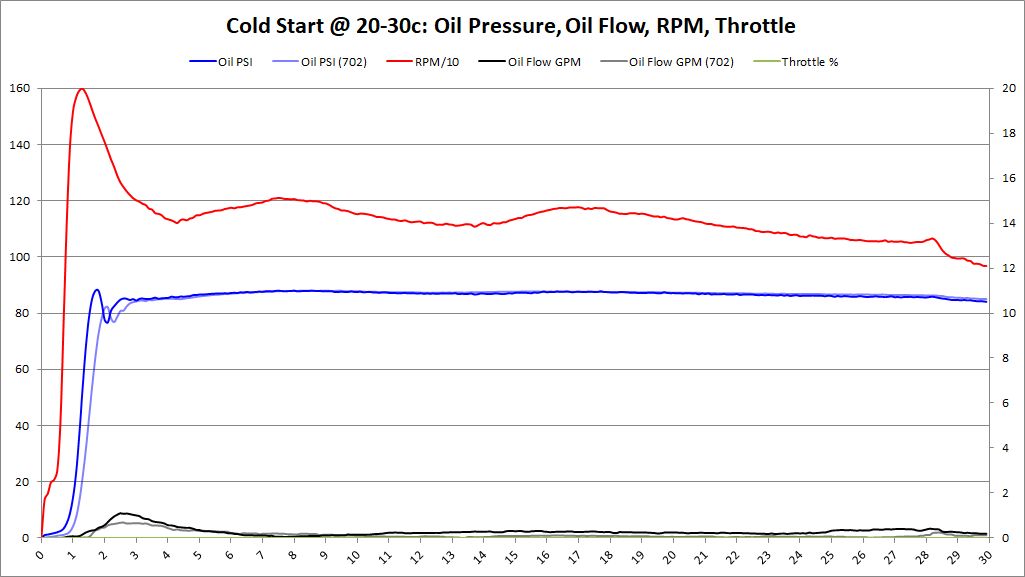
Generally it takes less than 3s to reach 90% pressure for both BE and BMW bearings. But why is there such a spike at the 60-80degC and 90-96degC temp ranges, up to 26s to reach 90%?. This seems very anomalous.
Is it a characteristic of the oil? |
|
Appreciate
0
|
| 12-28-2016, 07:02 PM | #12 |
|
Brigadier General

1688
Rep 3,140
Posts
Drives: 2014 M5 6MT
Join Date: Nov 2013
Location: Massachusetts
|
All this data and people just ask..." So what oil should I use?"
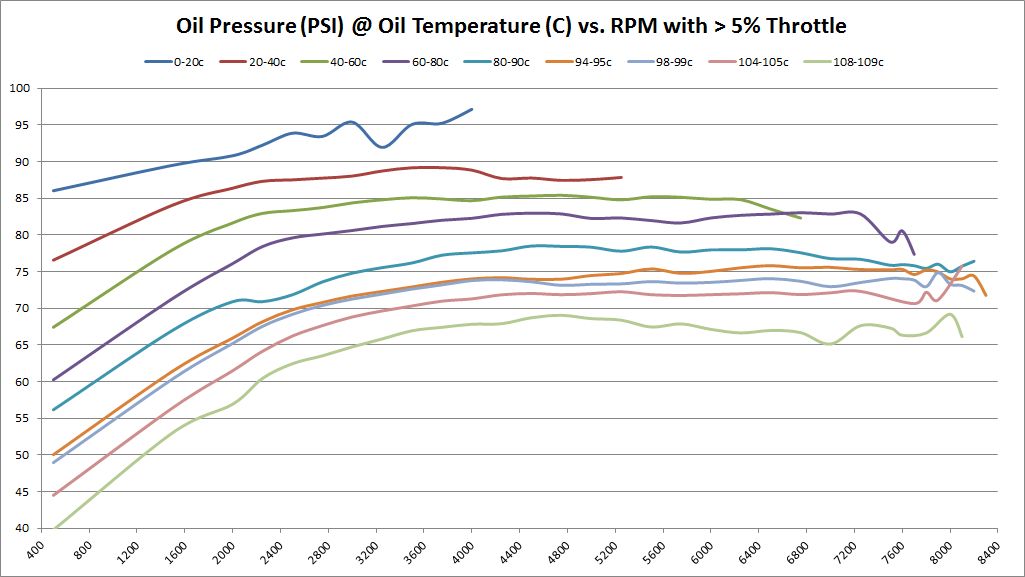
 Thanks for posting the data. I think it should be noted that MAIN bearing clearance has more to do with the total time it takes to reach 90% pressure, since thats the first obstruction to flow the oil will encounter. Tighter main clearances not only create more pressure, but also increase the time it takes for full oil pressure to develop.( since tighter tolerances reduce flow volume) Just a side note.
__________________
2014 M5 6MT
 |
|
Appreciate
0
|
| 12-28-2016, 07:10 PM | #13 | |
|
Colonel
 500
Rep 2,400
Posts |
Agree with this point, thx. Would be interesting to look at the underlying data itself to determine median, mode, std deviation and other measures/relationships.
Quote:
|
|
|
Appreciate
0
|
| 12-29-2016, 08:02 AM | #14 | |
|
First Lieutenant
104
Rep 303
Posts |
Quote:
|
|
|
Appreciate
0
|
| 12-29-2016, 03:16 PM | #15 | ||
|
Grease Monkey

295
Rep 2,646
Posts
Drives: 2011 E90 M3,1994 Euro E36 M3/4
Join Date: Apr 2006
Location: Fort McMurray, Alberta, Canada
|
Quote:
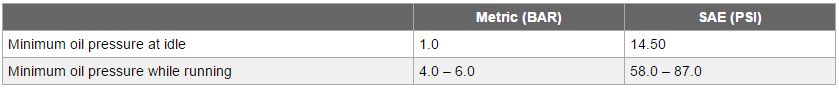
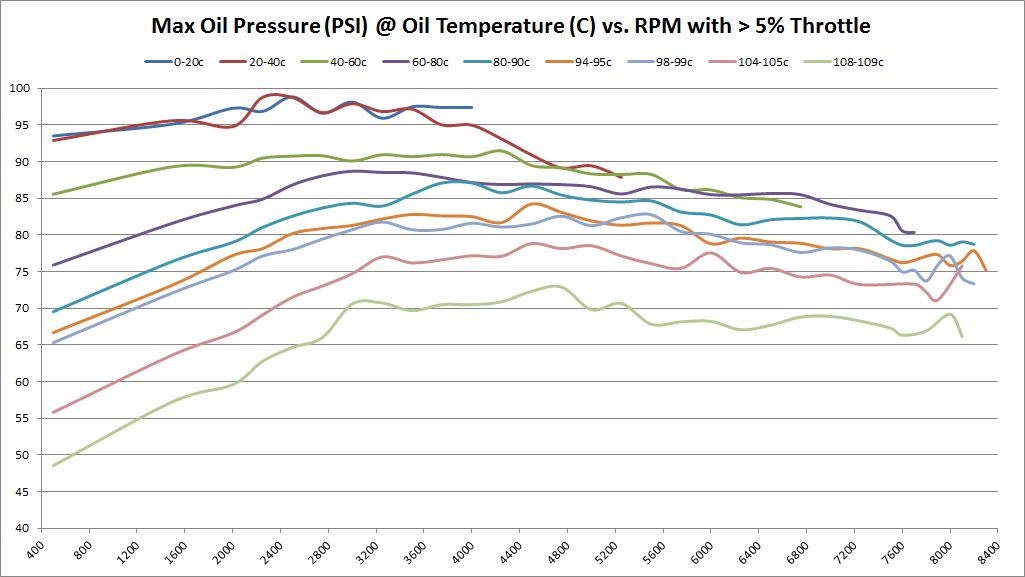
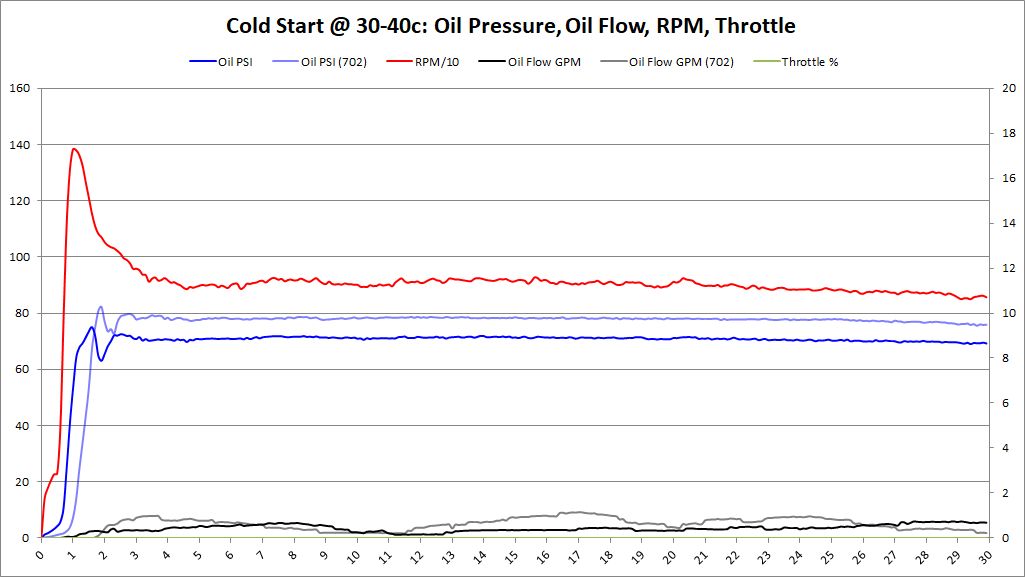
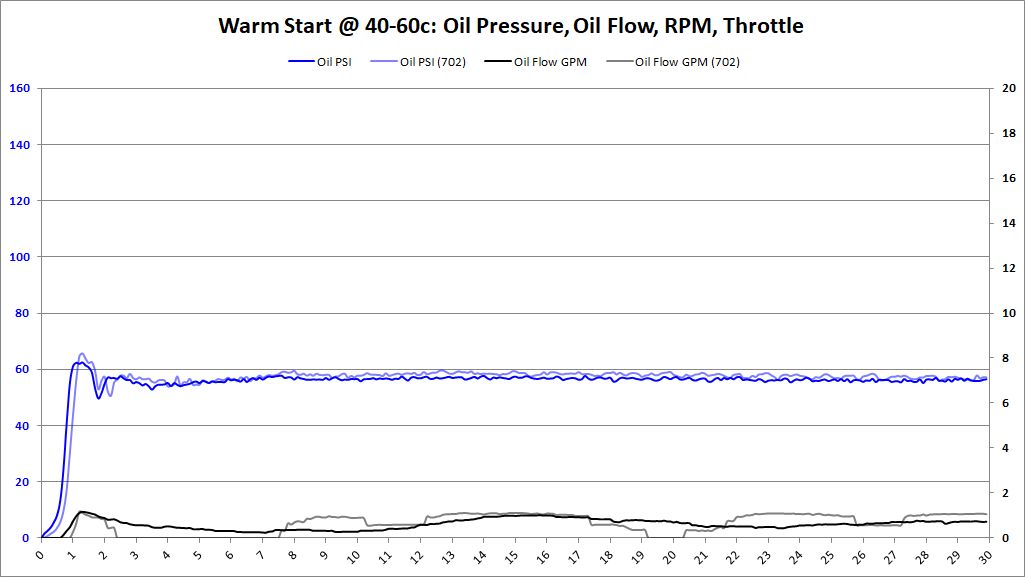
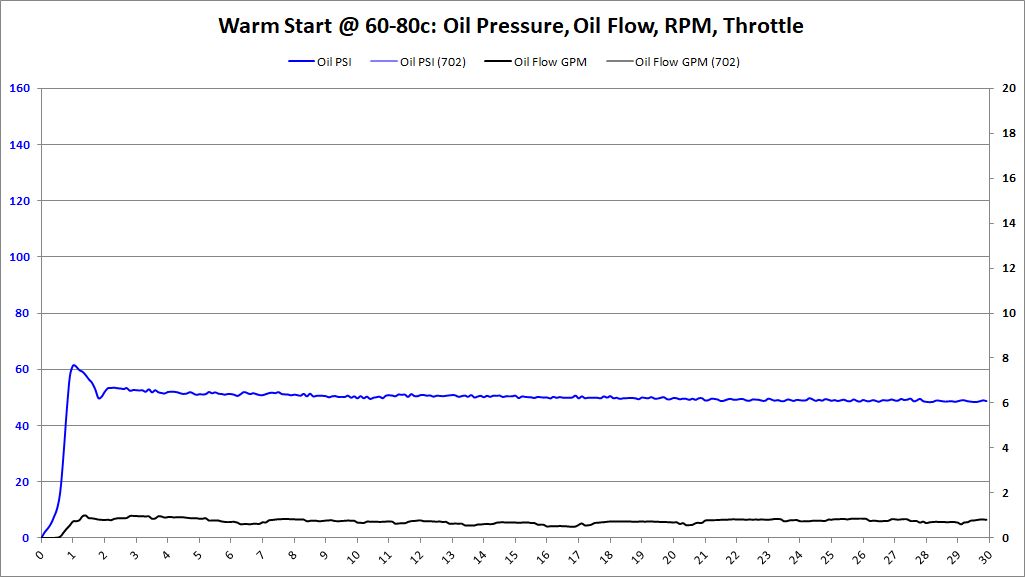
System oil pressure just ensures the bearings have a constant supply of oil to make up for loss of oil that is squeezed/spills out the sides of the journal bearing. Specs as per BMW for acceptable oil pressure of the S65 is 4-6 BAR or 58-87 PSI. Even with the 3 psi drop in pressure with the BE Bearings the engine is comfortably within the accepted range for oil pressure. |
||
|
Appreciate
0
|
| 12-29-2016, 04:36 PM | #17 | |
|
BimmerPost Supporting Vendor
1440
Rep 1,614
Posts |
Quote:
|
|
|
Appreciate
0
|
| 12-29-2016, 04:42 PM | #18 | |
|
BimmerPost Supporting Vendor
1440
Rep 1,614
Posts |
Quote:
There will be some reasonable conditions though. PM me if interested. |
|
|
Appreciate
0
|
| 12-29-2016, 05:54 PM | #19 | |
|
Brigadier General
3910
Rep 4,173
Posts |
Quote:
|
|
|
Appreciate
0
|
| 12-29-2016, 06:04 PM | #20 |
|
Major
 174
Rep 1,246
Posts
Drives: E92 M3
Join Date: Sep 2013
Location: Bellevue, WA
|
 <3 my Bearings! |
|
Appreciate
0
|
| 12-29-2016, 07:06 PM | #22 |
|
Lieutenant

50
Rep 511
Posts |
I don't understand all the technical stuff presented here at all, but I've recently fitted an ESS 625 kit and I want to change my bearings as a preventive measure.
Does this data show that BE bearings and the BE-spec ARP rod bolts should prove longer-lasting than the stock bearings or is it inconclusive so far? Now that quite a few people have had the BE bearings fitted for a while I was hoping to see regular reports from these users detailing the number of miles covered and perhaps oil analysis reports showing low levels of wear. That would be very reassuring to see. |
|
Appreciate
0
|
Post Reply |
| Bookmarks |
|
|