Quote:
Originally Posted by Sneaky Pete

But there are generic formula that you can use to calculate how oil flow changes with clearance and King Bearings have graphs which can be used to cross check that the number is at least in the ball park.
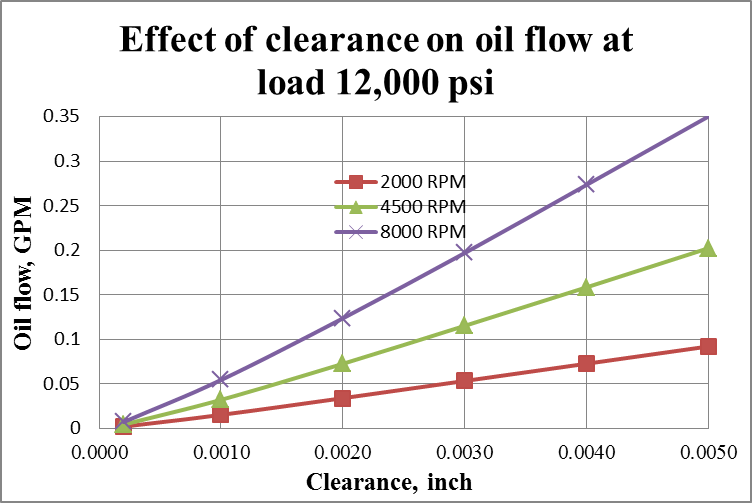
Now by my calculation(which could well be wrong) by increasing the clearance from 0.0017 to 0.0025 you would expect an increase in oil flow in the region of 50% at 8000rpm.
And the graph below suggests that the 50% number is indeed in the ballpark.
What you don't expect to get is a rise in flow of some 400%!
 |
Apparently that formula isn't nearly as generic as you say because you weren't able to use it when you were asked the same question months ago. But let's not get sidetracked. You have a very long history of fabricating and falsifying data. That seems very clear what you're doing here too. Even when you couldn't read a simple graph, it was clear the numbers you were pulling off of it were falsified because they appeared nowhere on the graph even when reading the wrong axes. If you were a reputable guy, I'd allow you to download the raw data and let you calculate the area under the curves so you could come up with some real numbers to replace your fabricated ones. But that's not even necessary. Anybody who objectively looks at the graphs can tell without a calculator that your falsified numbers don't add up.
We do appreciate the attention you keep bringing into this topic. Every time you respond, it brings more attention to this thread where new and old members alike can read about the topic, see all of the hard work that went into it, and see the dedication and expertise BE has put into the product. It seems that the data has proven itself to all objective viewers.