For those of you following this thread, ponder this:
I think it's kinda cool, actually.
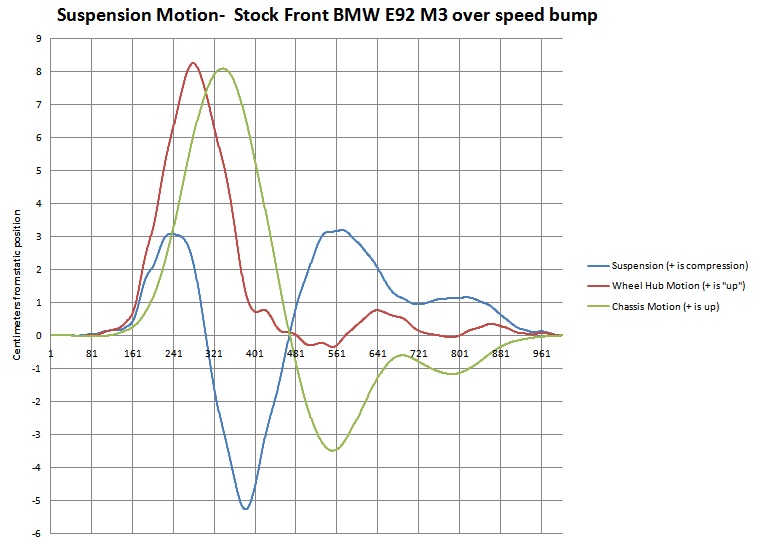
The context is that I ran the car at a modest speed over a speed bump. As you can see, the wheel (red line) ran over it, the body (green line) followed with a time delay, and the suspension (blue line) ran out of travel twice on compression at about 3cm upward travel with a 5cm extension in between.
The first "run out of travel" event (the blue line rises to 3 cm or so and stops rising) is when the suspension absorbs the rising side of the speed bump. Once there's no travel left, the body has to follow the rise of the wheel over the bump.
As the wheel goes over the top of the speed bump, it starts to drop, but the body continues rising. The suspension droops by 5 cm until the body starts to descend.
The second "run out of travel" event is when the wheel stops dropping down the backside of the speed bump and starts to roll level again. The chassis keeps descending, compressing the suspension down on the bumpstops until it too stops moving. It bounces a couple of times before settling.
The tire plays a critical role in the ride characteristics of the suspension. The brief descent of the "wheel" below ground level is evidence that the tire squashes (allowing the hub where the sensor is to drop below it's baseline position) absorbing some of the impact as the body drops onto the suspension.
Chassis sensor - attached to the bodywork in the engine bay. I strapped it firmly to the strut brace so it moved with the bodywork.
Wheel sensor - attached to the strut body behind the brake backing plate.
Both sensors on the driver's side.
This is a 1 second snippet of about 30 seconds of data, which in turn is one run out of about 15 segments in that specifci excursion accounting for about a half-hour of total data capture. The scale of the analysis is quite daunting!
The vertical index lines are about 0.10 seconds apart.